Inexplicable Results
So, with my new softmax back propagation sorted, I was excited to see how my model would perform, especially since softmax with MSE was my first hypothesis. Well, MSE was a disaster, although I didn’t push it too far. Softmax with cross-entropy was looking good. The cost function graph over training examples was very noisy. Far more than MSE with sigmoid. But the mean values of legal move outputs compared to illegal move outputs was trending in the right direction, as was the percentage of illegal moves. But starting at about 25,000 training games, things started to get crazy. As with sigmoid/MSE, inexplicably, the percentage of illegal moves in some training batches spiked really high (and low) and got really noisy as well. The spikes were far above where things should be for even random chance. And the overall percentage of illegal moves seemed (amidst noise that looked like the seismograph for a magnitude 7 earthquake), to be trending upwards.
So I decided to increase my batch size from 50 to 500, figuring a few things. First, perhaps such a small set of games in each training batch was somehow radically overfitting later in the training, and a batch size that was 10 times larger might help. Also, even if it didn’t actually fix things, it would reduce the noise in the graph.
Changing the batch size definitely reduced the noise, but didn’t really fix the fundamental problem. here are the graphs:
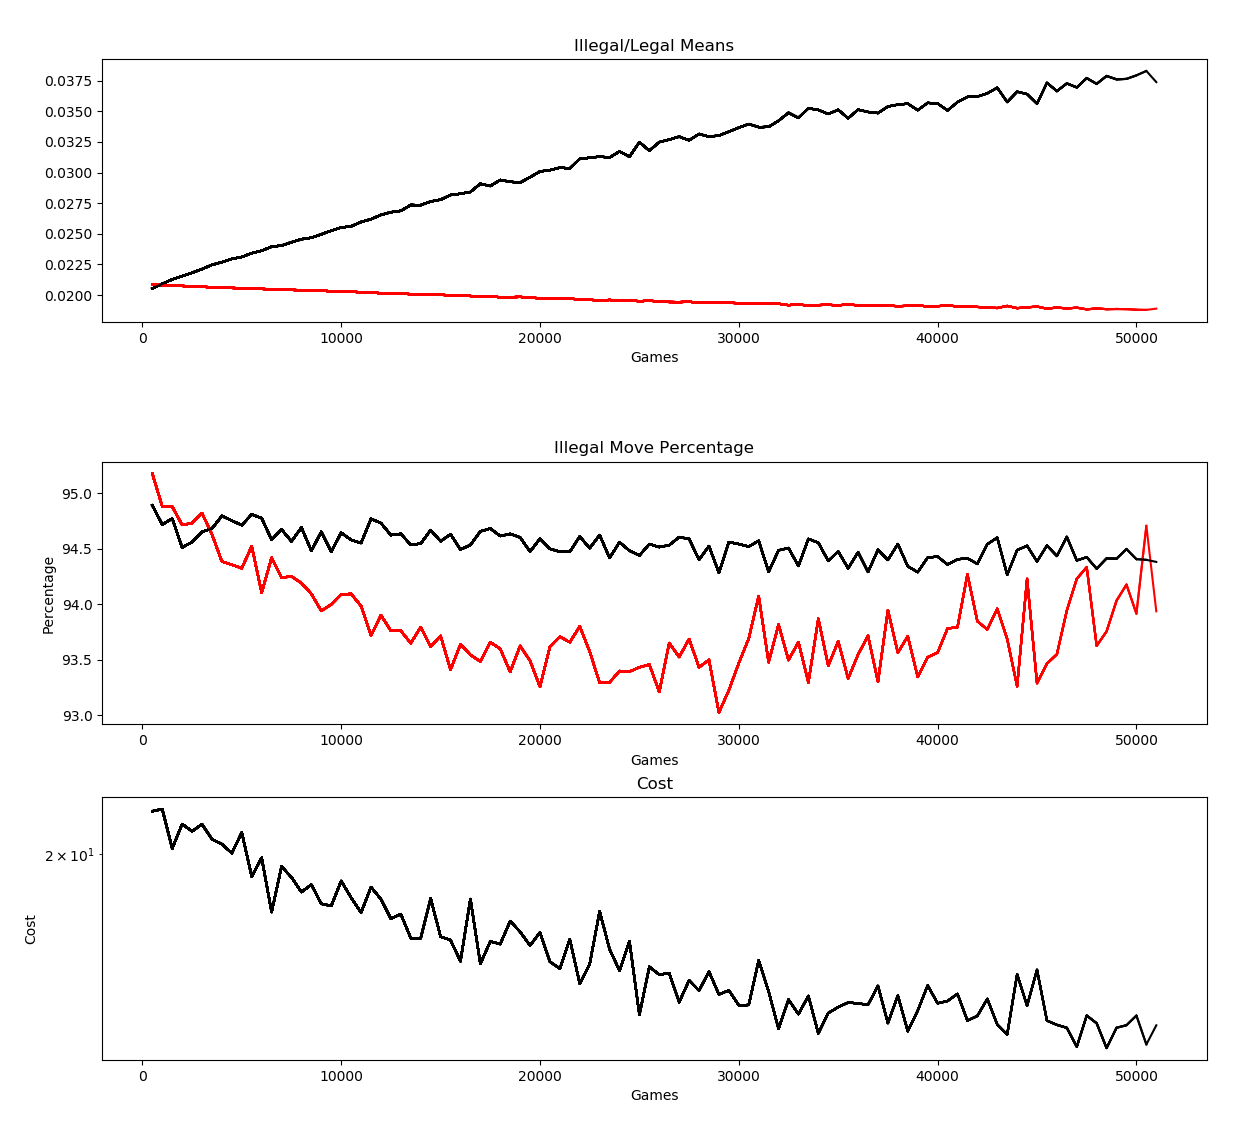
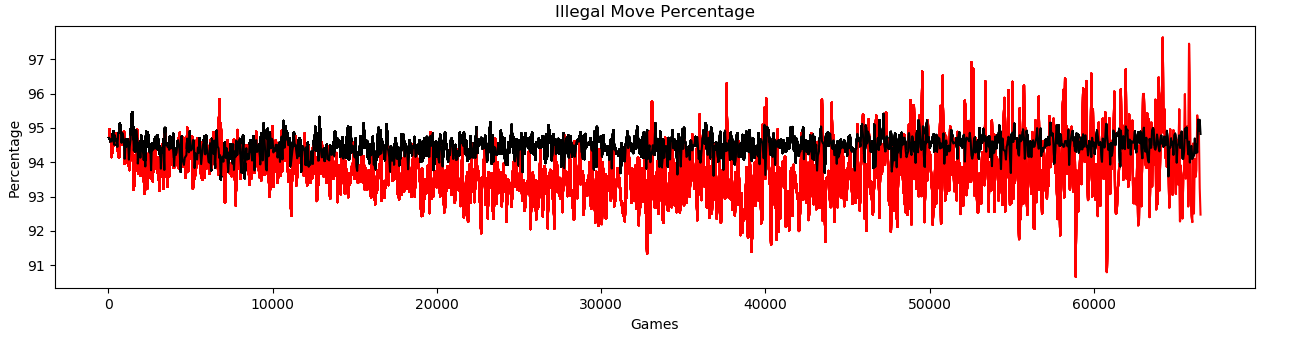
The cost is (noisily) trending in the right direction, and the mean value of legal move outputs is going up, while illegal moves are going down. And yet the percentage of illegal moves, after trending downward, suddenly becomes much more noisy, with spikes that go way above the percentage that random chance should produce. The illegal move percentage actually doesn’t look so bad in this graph, but looking at training batches of 50, it didn’t look all that different from my sigmoid/MSE graphs, one of which is here:
I have a lot of ideas about what might solve this little problem, but before I get to that, I’ve decided I need to actually see what in the world is going on here. One thing that’s not part of anything I can graph is what I see when the model is actually playing the games. Oftentimes, I can see a single game suddenly shoot the cumulative percentage of illegal moves for the past 50 or more games up a couple of percentage points. That means a single game might well have over 99% illegal moves. Certainly if one point in the graph (which is a batch of 50 games) is near 98% illegal moves, there are single games that are well above 99%.
Think about what that actually means. The way the game play works is that the model generates its probabilities for each output, and according to those probabilities, the actual choice of moves is a roll of the dice. So the way it works is that the dice roll, a move is generated, and if it’s illegal, you roll the dice again with the same probabilities. The algorithm just keeps doing that until it comes up with a legal move, and that’s the move that gets made. Thus, a 99% illegal move percentage over a single game means that more or less, on average, over that game, the algorithm generated 99 illegal moves before generating a legal move. Whereas, for random play, that number should be around 17 (which corresponds to about 94.5% illegal moves).
So I need to see what is actually going on in a game like that. When I first got the actual game mechanics in place, I had a routine (that I no longer use) that can generate a text version of the board state for every move and save it to a text file after play completes. What I need to do is for each board state, for the model player not only show the board state but also the following:
- What probabilities got generated for each output.
- What the illegal moves mask was for each output.
- Which of those illegal moves masks were because of
- blocked positions
- non-king pieces
- mandatory jump requirements
- piece being removed from the board
- What illegal moves got generated before each legal move
I have all sorts of ideas about where these spikes are coming from, but they’re all speculative, and some don’t even really make sense. I need to understand this better.